
Bad Data Virus: The Enterprise Anti-Pattern That Breaks Trust
How to spot it early, contain the spread, and build “quality by design” with contracts, tests, and observability.


If you’re a CIO choosing centralised data clean-up vs distributed data ownership, use the matrix below.
Bad data doesn’t fail loudly. It quietly rewrites decisions.
Most teams only notice when the numbers don’t match in an exec meeting or when a customer asks the awkward question first.
In 7 minutes you’ll have a way to diagnose, contain, and prevent it.
The CIO matrix: “Clean-up squad” vs “Quality by design”
Most leaders don’t choose between these because they love one approach. They choose because something has already gone wrong: a board pack number is challenged, a revenue metric shifts overnight, or three dashboards tell three stories.
This matrix is a quick way to decide what you need first: a fast containment move, or a structural fix that stops repeat outbreaks.
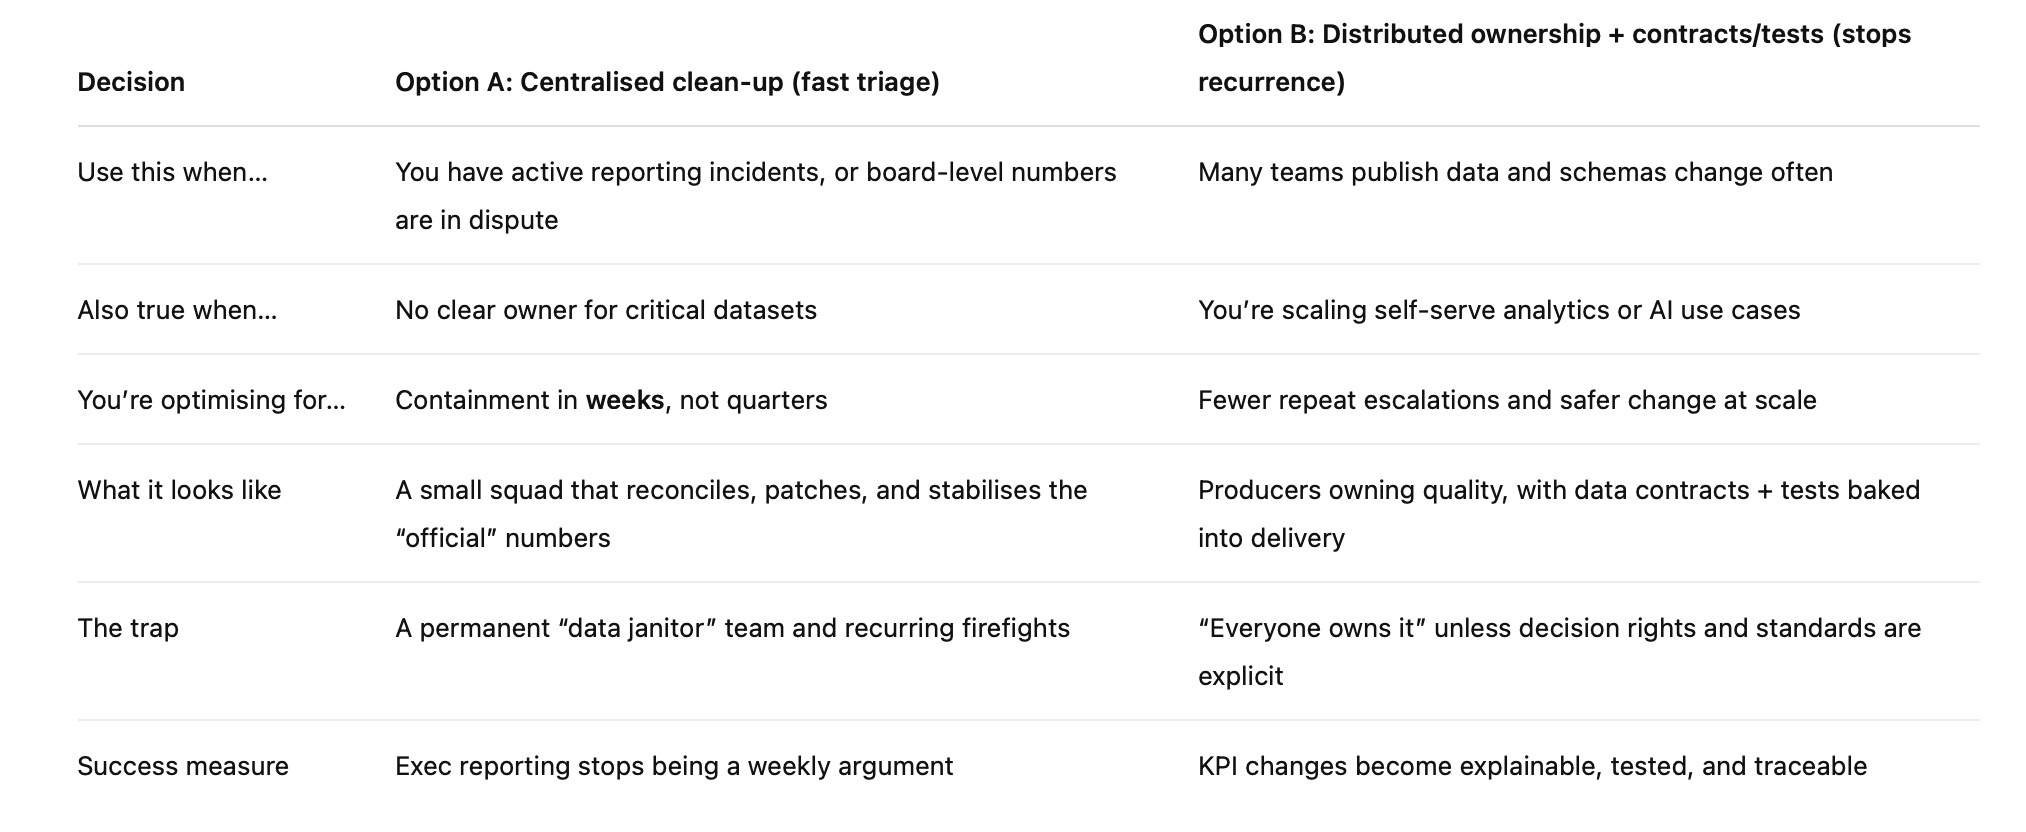
Now the honest bit: most enterprises need both. Option A is what you do when the house is already smoky. It buys you time and restores confidence. Option B is what stops the next fire by making quality part of normal delivery, not an after-hours rescue mission. A contains today’s outbreak. B is the vaccine.
10-point “Bad Data Virus” early warning checklist
If you want the fastest diagnosis, don’t start with tooling. Start with behaviour. When a bad data virus is spreading, you’ll see it in how people act before you see it in logs.
Read this like a quick health check. If you’re nodding along to three or more, you’re not dealing with a one-off defect — you’re dealing with a pattern.
Same metric, three dashboards, three answers (and everyone has a “reason”)
Teams can’t name the source of truth, only the dashboard they prefer
Manual CSV “fixes” happen right before every exec meeting
No shared definitions for key fields (customer, active, churn)
Pipelines succeed, but the numbers are wrong, green jobs, red outcomes
Schema changes ship without notice, and downstream teams find out the hard way
Data quality checks exist, but nobody watches alerts (or alerts are ignored noise)
Ownership is unclear (producer vs consumer blame cycle)
AI/ML outputs drift and nobody can trace which inputs changed
The data team is stuck doing ad-hoc reconciliations instead of building capability
If this feels familiar, good news: you don’t need a miracle platform. You need a clean decision on containment vs prevention and then a simple operating model that makes quality repeatable.
What the “Bad Data Virus” anti-pattern looks like
The pattern in one sentence
Bad data enters quietly, gets copied everywhere, and becomes “truth” through repetition.
Why “virus” is the right metaphor
It rarely arrives as a big, obvious failure. It slips in as a missing field, a duplicated record, a “temporary” mapping, or a late change to a definition. Then it multiplies. ETL jobs pick it up, extracts ship it to other teams, reverse ETL pushes it back into operational tools, and downstream marts bake it into KPIs. Before long, it’s in spreadsheets, board decks, and AI features — and unwinding it becomes harder than building it correctly in the first place.
The cost isn’t just wrong numbers
The real damage is behavioural. Decision latency creeps in: teams hesitate, double-check, and delay because they stop trusting what they see. Then governance overhead follows: more meetings, more approvals, more “alignment”, and less delivery.
A useful anchor: data quality is simply fitness for use.
How bad data spreads in modern architectures
Three common transmission paths
Bad data doesn’t need a fancy failure mode. It spreads through normal delivery work, especially when speed wins, and nobody owns the “downstream blast radius”.
Path 1: Operational systems → analytics.
Source systems aren’t built for clean reporting. Capture rules vary by team, fields get reused for new meanings, and updates arrive late. Add duplicate keys, merges, and backfills, and you get dashboards that look stable until they suddenly aren’t.
Path 2: “Helpful” transformations.
This is where good intentions turn into long-term pain. Someone patches a logic gap in a pipeline: a mapping table, a filter, a “quick fix” to match finance numbers. If that logic isn’t documented and tested, it becomes invisible business policy, and it quietly diverges from what the business thinks is happening.
Path 3: Self-serve scale.
Self-serve analytics is great, until it isn’t. More consumers means more extracts, more copies, and more versions of “truth”. Two teams can start from the same dataset and still ship conflicting definitions of the same metric.
The silent killer: breaking changes
Schema drift and incompatible changes break consumers even when pipelines are “green”. The jobs run. The tables load. The numbers are just wrong, or worse, wrong in a way that looks plausible.
Root causes CIOs should look for
Ownership gaps
The most common root cause is also the least technical: nobody can clearly say who owns quality for a dataset that matters. “The data team owns quality” sounds tidy, but it becomes a loophole. Producers change fields, tweak definitions, or ship new logic to hit delivery dates. Consumers then discover the impact days later, usually when a KPI shifts and someone starts asking for screenshots. The blast radius lands downstream, and everyone argues about whose job it is to fix it.
No contracts, no tests, no alarms
When there’s no contract, expectations live in people’s heads: what a field means, what “complete” looks like, how fresh the data should be. That’s tribal knowledge, not an engineering system. Without tests, regressions slip through even the boring ones like not-null, uniqueness, and referential integrity. And without observability, you don’t find out early. You find out in the exec meeting, with a graph on screen and zero time to explain it.
Misaligned incentives
Most organisations reward feature shipping. Data correctness is treated as “maintenance” until it becomes a crisis. When incentives don’t match the risk, bad data becomes predictable.
The fix in three moves: contain, treat, vaccinate
1) Contain the outbreak (what to do this month)
When trust is already wobbling, your first job is to stop the spread. Pick the KPI that’s causing the most noise (usually revenue, active customers, churn, or risk exposure) and quarantine the metric. Name one “official” dataset for that KPI and freeze definition changes for a short window. You’re not trying to solve all data quality this month you’re buying stability so people can make decisions again.
Next, create a lightweight data incident loop. Keep it simple: P0 for exec metrics and board reporting, P1 for customer impact, P2 for internal issues. Use one channel and one comms owner, so updates aren’t scattered across Slack threads, email chains, and meetings. If you can’t say who owns comms, you don’t have an incident process; you have chaos with a spreadsheet.
Finally, stop the worst replication. The fastest way bad data becomes permanent is through uncontrolled extracts and “shadow marts” that nobody admits owning. For critical domains, temporarily block or gate ad-hoc exports and duplicate marts until the official source is stable.
2) Treat the source (what to do this quarter)
Containment is triage. Treatment is where you remove the root cause. Start by defining “fitness for use” for each critical dataset in plain language. Don’t overthink it, just be explicit about the basics: accuracy, completeness, timeliness, uniqueness, and consistency.
Then implement automated checks where the data lives, not three layers downstream. Begin with high-signal tests that catch real breakages early: not-null, uniqueness, accepted values, and relationship tests (think referential integrity between key tables). Add richer rules only when you need them, using a validation framework like Great Expectations, especially for complex expectations or anomaly-style checks.
Make quality visible. Track it like a product metric, not a one-off project. A weekly scorecard for the top 10 datasets visible to both producers and consumers changes behaviour fast. When teams see quality trends, they stop treating data issues as “random” and start treating them as engineering.
3) Vaccinate with “quality by design” (what to do over 6–12 months)
Now you prevent recurrence. For critical data products, introduce data contracts and treat them like APIs for data: schema, constraints, freshness expectations, and change rules. This is how you stop “surprise” from becoming normal.
Back it with schema evolution discipline. Backwards compatible changes by default. Breaking changes require explicit versioning and a migration plan. No exceptions for “it’s just analytics”.
Add data observability so you learn early: monitor freshness, volume, distribution shifts, lineage, and failures. If the first time you notice a problem is the monthly exec pack, you’re running blind.
Finally, build governance teams can live with: federated guardrails, not a central bottleneck. Set minimum controls and clear decision rights, then let teams move fast inside the rails.
A practical operating model (so this doesn’t become theatre)
Decision rights (keep it crisp)
Most data programs fail for the same reason: everyone agrees quality matters, then nobody has the pen when a trade-off shows up. The fix is boring, clear decision rights.
Data Producer owns correctness at the source. They control schema changes and they’re accountable for contract compliance when they publish data.
Data Product Owner owns definitions, SLAs, and consumer outcomes. They decide what “active customer” means and what “good enough” looks like for freshness and completeness.
Platform Team provides the paved road: tooling, pipelines, observability, templates, and patterns that make the right thing the easy thing.
Governance sets minimum controls and arbitrates red lines (the small number of issues where risk or compliance means you can’t “just ship it”).
Two rules that stop 80% of pain
No breaking changes without a version and a migration plan.
No tier 1 KPI without tests and a clear alerting path (who gets paged, and what “action” looks like).
30/60/90-day plan (actionable, not heroic)
Days 0–30: Pick three exec KPIs and declare a single source of truth for each. Write the definition in plain English and publish it where teams actually look. Add basic tests (not-null, uniqueness, accepted values) and route alerts to one channel with a named owner, so issues don’t die in silence.
Days 31–60: Publish data contracts for those KPIs: schema, constraints, freshness targets, and change rules. Put a schema change workflow in place (review + versioning) so breaking changes can’t sneak in as “just a small tweak”.
Days 61–90: Expand the approach to the top 10 datasets that drive decisions. Start measuring reliability like an engineering outcome: incidents per month, MTTR, and a simple “trust score” your execs can understand.
Closing
Bad data isn’t a tooling problem first. It’s an ownership and change-management problem that tools can enforce. Containment buys you time. Contracts and tests buy you trust, and trust is what lets teams move fast without weekly reconciliation theatre.
If you want more run-it-on-Monday architecture and governance playbooks, subscribe to the newsletter.